Documentation
Time Weighted Total Returns (CFA GIPS standard)
Performance displayed in Feather Finance follows the GIPS Time Weighted Total Return standard:
- Feather Finance displays Total Returns (includes the effect of dividend, fees, etc.).
- Feather Finance calculates time-weighted rates of return that adjust for external cash flows. Both periodic and sub-period returns are geometrically linked. No assumptions are made with regards to external cash flows: they are accounted for on the day they occur (I.E. daily).
- Returns from cash and cash equivalents held in portfolios are included in all return calculations.
- All returns are calculated after the deduction of the actual trading expenses incurred during the period.
Other Metrics
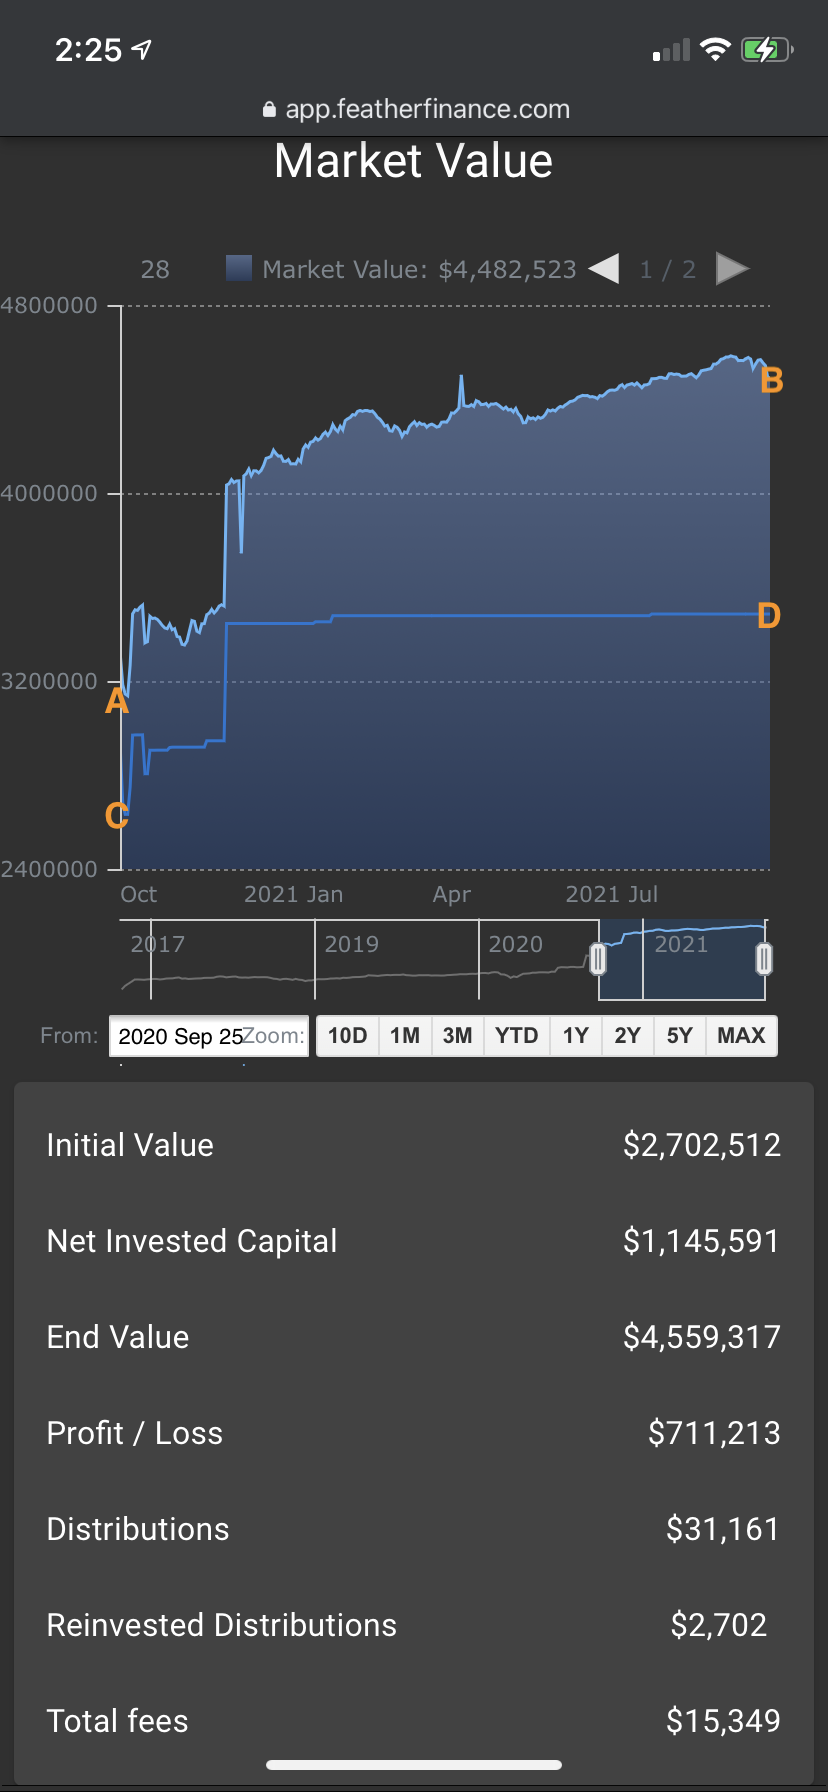
- Initial Value: Market value of the portfolio at the begining of the period being displayed (point A on the example chart to the right).
- Net Invested Capital: Net capital invested (e.g. wire-ins minus wire-outs) during the period of interest (point D minus point C on the example chart to the right).
- End Value: Market value of the portfolio at the end of the period being displayed (point B on the example chart to the right).
- Profit / Loss: End Value minus Initial Value minus Net Invested Capital (B-A-D+C)
- Distributions: Cash dividends received.
- Reinvested Distributions: Dividends that were reinvested in kind.
- Total fees: Fees paid by the portfolio (doesn’t include fees built into ETFs / mutual funds)
Note that, when filters are applied on the portfolio, these metrics are calculated on the subportfolio being filtered.
Filters
You can drill down and analyze subsets of your portfolio by applying filters. For example, this video shows how to apply a filter to analyze the historical performance of your trading on a given symbol.
The performance metrics calculated on the filtered portfolio comply with CFA Institute’s GIPS Standards. For example, if the symbol pays dividends, they will be included in the filtered portfolio’s time weighted returns.
Feather Finance lets you filter on the following fields:
- Account
- Symbol
- Label
- Currency
- Type (i.e. transaction type)
- Instruction (i.e. buy or sell)
Filter Adjusments (by Symbol / by Label)
When filtering by Symbol or by Label, Feather Finance needs to make assumptions regarding the funding of the filtered portfolio in order to calculate meaningful performance numbers.
The assumed funding activities will appear in blue in the Activities table, and are assigned special activity types: “Filter Adjustment Wire-Out” and “Filter Adjustment Wire-In”.
Filter by Symbol
-
Filter-In Specific Symbols
- Think of the filtered portfolio as a virtual sub-portfolio created for the sole purpose of segragating all the trading activity on specific symbols.
- In the Filter Symbol Dialog, you filter-in symbols by selecting only certain symbols (i.e. all the other symbols are unchecked, and activity with ‘(EMPTY)’ symbols are also unselected).
- The following assumptions are necessary in order to calculate meaningful returns for the filtered portfolio / virtual sub-portfolio:
- for each filtered-in buy transaction: Feather Finance assumes you wire in just enough cash in the filtered portfolio / virtual sub-portfolio (just in time to settle the transaction).
- for each filtered-in sell transaction: Feather Finance assumes proceeds from sales are wired out of the filtered portfolio / virtual sub-portfolio (on the same day as the sale).
- for each dividend on a filtered-in symbol: an equivalent amount is assumed to be wired out of the filtered portfolio / virtual sub-portfolio (on the same day the dividend is paid)
- When you filter-in on one symbol, the above methodology is equivalent to assuming that divdends are reinvested: the filtered portfolio is fully invested in the symbols that are filtered-in, and never has any cash balance outstanding.
-
Filter-Out Specific Symbols
- Think of the filtered portfolio as a virtual sub-portfolio that is identical to your main portfolio except fot the fact that all the trading activity on the filtered-out symbols has been moved out of the virtual sub-portfolio.
- In the Filter Symbol Dialog, you can filter-out a set of symbols and leave all the others checked (ie. all other activities are included – including those with ‘(EMPTY)’ symbols)
- The following assumptions are necessary in order to calculate meaningful returns for the filtered portfolio / virtual sub-portfolio:
- for each filtered-out buy transaction: the cash amount paid to settle the purchase is instead assumed to be wired-out of the virtual sub-portfolio.
- for each filtered-out sell transaction: a cash amount equivalent to the proceeds of the sale is assumed to be wired-in to the virtual sub-portfolio.
- Here is the rationale: imagine a portfolio in which you bought 100 SPY, and sold 100 SPY one year later. You are wondering how the portfolio would have performed had you not traded SPY. The above logic lets you compare two scenarios:
- The unfiltered scenario gives the returns of the actual portfolio including the SPY transactions (i.e. when no filter is applied)
- The “SPY filtered-out” scenario gives the returns on a hypothetical portfolio in which instead of buying/selling 100 SPY, you would have wired out a dollar amount equivalent to the cash amount of the buy, and later wired in a dollar amount equivalent to the sales proceed.
Filter by Label
The logic when filtering by Label is essentially the same as when filtering by Symbol:
-
Filter-In Specific Labels
- Think of the filtered portfolio as a virtual sub-portfolio created for the sole purpose of segragating all the trading activity that is tagged with a given label.
- In the Filter Label Dialog, you filter-in labels by selecting only certain labels (i.e. all the other labels are unchecked, and activities with ‘(EMPTY)’ labels are also unselected).
- The following assumptions are necessary in order to calculate meaningful returns for the filtered portfolio / virtual sub-portfolio:
- for each filtered-in buy transaction: Feather Finance assumes you wire in just enough cash in the filtered portfolio / virtual sub-portfolio (just in time to settle the transaction).
- for each filtered-in sell transaction: Feather Finance assumes proceeds from sales are wired out of the filtered portfolio / virtual sub-portfolio (on the same day as the sale).
- for each filtered-in dividend : an equivalent amount is assumed to be wired out of the filtered portfolio / virtual sub-portfolio (on the same day the dividend is paid)
-
Filter-Out Specific Labels
- Think of the filtered portfolio as a virtual sub-portfolio that is identical to your main portfolio except fot the fact that all the trading activity tagged with a given label has been moved out of the virtual sub-portfolio.
- In the Filter Label Dialog, filter-out a set of labels, and leave all the other labels filtered-in (ie. all other activities are included – including those with “(EMPTY)” labels)
- The following assumptions are necessary in order to calculate meaningful returns for the filtered portfolio / virtual sub-portfolio:
- for each filtered-out buy transaction: the cash amount paid to settle the purchase is instead assumed to be wired-out of the virtual sub-portfolio.
- for each filtered-out sell transaction: a cash amount equivalent to the proceeds of the sale is assumed to be wired-in to the virtual sub-portfolio.
- Here is the rationale: imagine a portfolio in which you have tagged a buy 100 SPY, and tagged a sell 100 SPY. You are wondering how the portfolio would have performed had you not traded that particular strategy. The above logic lets you compare two scenarios:
- The unfiltered scenario gives the returns of the actual portfolio including the tagged transactions (i.e. when no filter is applied)
- The filtered scenario gives the returns on a hypothetical portfolio in which instead of buying/selling 100 SPY (i.e. the transactions labeled with a tag), you would have wired out a dollar amount equivalent to the cash amount of the buy, and later wired in a dollar amount equivalent to the sales proceed.
Labels
You can tag activities with labels to identify subsets of your portfolio. Our concept of label is similar to Gmail’s concept of labels – they provide a flexible way to organize & filter your different trading activities.
Tag Trades In the WebApp
- In the Overview page, go to the Activities table.
- Open the Edit Activity dialog by clicking on the three vertical dots (right most button of each table row).
Tag Trades Programatically (Alpaca)
-
Alpaca’s client_order_id field is an optional parameter that you can send to Alpaca’s POST /v2/orders endpoint.
-
Tag a custom label to an order by specifying a client_order_id parameter in the following format:
custom_order_id = "MYCUSTOMLABEL" + "_FF_" + my_custom_id;- where MYCUSTOMLABEL is the label that will feed to Feather Finance, _FF_ is a delimiter used by Feather Finance, and my_custom_id is a unique identifier for the order.
-
For the tech-savvy: here is the regular expression we use to extract the label from the client_order_id:
/(^.+)_FF_.*/. -
This tutorial video gives a detailed description of the process:
Public API
Use Feather Finance’s public API to pull your portfolio data into spreadsheets and third party apps.
You need a token to access your Feather Finance account via API (see user Profile page).
API server:
https://api-master.featherfinance.com:8181
Endpoints:
GET /v0/portfolio/historyGET /v0/portfolio/positionsGET /v0/portfolio/positionsdetailsGET /v0/portfolio/transactionsGET /v0/portfolio/transactionsdetailsGET /v0/recon-questrade/positionsGET /v0/recon-alpaca/positions
GET /v0/portfolio/history
Description
- Get timeseries data about equity and profit/loss (P/L) of the account in requested timespan.
Query Parameters
account: Query only for given account(s) only. You can provide a list of accounts delimited by the tilde symbol ‘~’ (optional)displayCurrency: ‘USD’ or ‘CAD’endDate: end date in format ‘YYYY-MM-DD’format: ‘JSON’ or ‘CSV’labelFilter: Labels to filter into the query. See video for more explanation on how to use trading strategy labels.order: ‘ASC’ or ‘DESC’startDate: start date in format ‘YYYY-MM-DD’symbol: Query only for given symboltoken: API Token (see user Profile page)
Response Example
GET /v0/portfolio/positions
Description
- Get positions history.
Query Parameters
account: Query only for given account only.displayCurrency: ‘USD’ or ‘CAD’startDate: start date in format ‘YYYY-MM-DD’endDate: end date in format ‘YYYY-MM-DD’frequency: either ‘DAILY’ / ‘WEEKLY’ / ‘EOM’ / ‘EOQ’ / ‘EOY’ (defaults to ‘DAILY’)format: ‘JSON’ or ‘CSV’token: API Token (see user Profile page)
Response Example
GET /v0/portfolio/positionsdetails
Description
- Get positions history, with more details.
Query Parameters
account: Query only for given account(s) only. You can provide a list of accounts delimited by the tilde symbol ‘~’ (optional)displayCurrency: ‘USD’ or ‘CAD’endDate: end date in format ‘YYYY-MM-DD’format: ‘JSON’ or ‘CSV’token: API Token (see user Profile page)
Response Example
GET /v0/portfolio/transactions
Description
- Get transactions history.
Query Parameters
accounts: Query only for given account(s) only. You can provide a list of accounts delimited by the tilde symbol ‘~’ (optional)endDate: end date in format ‘YYYY-MM-DD’displayCurrency: ‘USD’ or ‘CAD’format: ‘JSON’ or ‘CSV’order: ‘ASC’ or ‘DESC’startDate: start date in format ‘YYYY-MM-DD’token: API Token (see user Profile page)
Response Example
GET /v0/portfolio/transactionsdetails
Description
- Get transactions history, with more details.
Query Parameters
account: Query only for given account only.displayCurrency: ‘USD’ or ‘CAD’endDate: end date in format ‘YYYY-MM-DD’format: ‘JSON’ or ‘CSV’order: ‘ASC’ or ‘DESC’startDate: start date in format ‘YYYY-MM-DD’endDate: end date in format ‘YYYY-MM-DD’token: API Token (see user Profile page)
Response Example
GET /v0/recon-questrade/positions
Description
- Get current positions, as reported by Questrade, by calling Questrade’s enpoints (v1/accounts/:id/balances & v1/accounts/:id/positions).
Query Parameters
format: ‘JSON’ or ‘CSV’token: API Token (see user Profile page)
Response Example
GET /v0/recon-alpaca/positions
Description
- Get current positions, as reported by Alpaca, by calling Alpaca’s enpoints (v2/account & v2/positions).
Query Parameters
format: ‘JSON’ or ‘CSV’token: API Token (see user Profile page)
Response Example
GET /v0/recon-nbin/positions
Description
- Get current positions, as reported by NBIN and SGGG.
Query Parameters
format: ‘JSON’ or ‘CSV’token: API Token (see user Profile page)date: recon date in format ‘YYYY-MM-DD’
Response Example